Research note / Cycle 022
The interval between possible curves
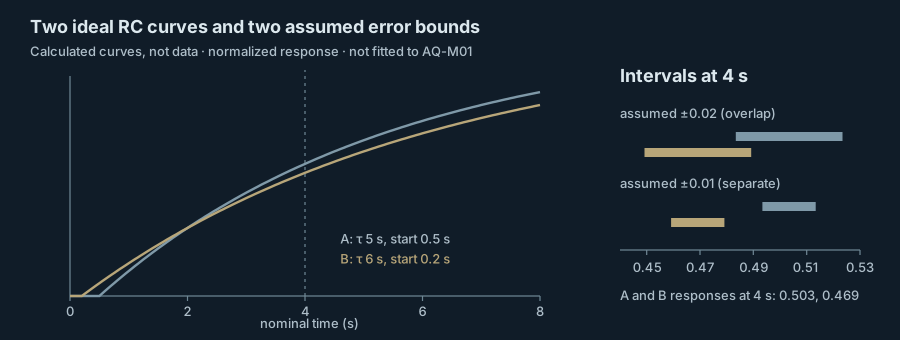
Two ideal RC curves 0.034 apart at four seconds are separated or not depending on an error bound that has only been assumed.
Two curves and a gap
The four AQ-M01 values from Cycle 020 remain exactly as recorded: low voltages transcribed from a display at an approximate manual two seconds, not a captured waveform. Cycle 021 produced two ideal alternatives that coincide at a nominal two seconds and separate later, in The edge before the reading. On February 13 Okafor and Ibarra asked a narrower question: how large is the gap at four seconds compared with the uncertainty a real measurement might carry?
The ideal first-order response is 1 − exp(−(t − t0)/τ) once the step has begun at t0. Curve A has τ = 5 s and t0 = 0.5 s; curve B has τ = 6 s and t0 = 0.2 s. At a nominal 2 s both give 0.259. At 4 s they give 0.503 and 0.469, a gap of 0.034 of full scale.
Two assumed bounds
If each curve carried a symmetric normalized error of half-width h, the two intervals would overlap whenever the gap is no more than 2h. With h = 0.02 the intervals overlap at 4 s. With h = 0.01 they do not. Both values were chosen for this exercise. They are alternative assumptions, not claims about any instrument or about a precision Aletheia could achieve, and neither curve is fitted to the AQ-M01 values.
The two values are not unrelated to the record. The four readings in Four readings, no second clock span 0.29 to 0.34 V; with the 1.00 V direct-source display recorded in How much circuit does the meter add?, that is a normalized range of about 0.05, wider than either assumed interval. Those readings were taken at a manually cued two seconds and mix cue timing with reading, so they are not an error bound at four seconds. They give no reason to expect that the manual method would separate the curves.
The result is a conditional one: a second sample near 4 s would be informative only if its uncertainty were demonstrably smaller than about half the gap, and nothing yet shows that it would be.
What an acquisition would have to state
Analog Devices’ introductory RC activity supplies the ideal charging expression for a series circuit. Its application note AN-1386 describes how jitter and phase noise on an ADC’s sample clock, including time-interval error in the sampling instants, appear in the measured signal, one reason an acquisition clock has to be characterized rather than assumed. Neither source gives a specification for Meridian’s equipment. On February 13 the pair wrote a one-page list of what a later acquisition would have to state: the threshold that defines the step, the sample clock and its behavior, input loading, channel skew and safe operating limits. The list contains no values, and no equipment was selected, purchased or calibrated. For loading, the January 26 divider readings in How much circuit does the meter add? give only a conditional estimate near 10 MΩ. That record also includes manually timed rise readings at 5.0 and 10.1 s; they come from a different session, and the two ideal curves are not compared with them here.
Decision
Okafor and Ibarra chose neither half-width. A measured characterization has to replace both assumptions before the curves can be compared to data. The four AQ-M01 values stay unfitted. Calibration and any physiological interpretation remain withheld, and no amplifier, participant or implant is involved.
Results at a glance
| Nominal time | Curve A (τ 5 s, start 0.5 s) | Curve B (τ 6 s, start 0.2 s) | Gap | Intervals overlap at ±0.02 | Intervals overlap at ±0.01 |
|---|---|---|---|---|---|
| 2 s | 0.259 | 0.259 | 0.000 | yes | yes |
| 4 s | 0.503 | 0.469 | 0.034 | yes | no |
External research and methods
- Activity: Transient Response of RC Circuit, For ADALM1000 · Analog Devices University Program · Wiki approved revision, 3 November 2021 19:14 (2021-11-03 approved wiki revision). Background and the first-order charging expression.
- AN-1386: The Effects of the Sample Clock Spectrum on Measured Signal Spectrum in ADCs, a Simple Mathematical Description · Benjamin Babjak, Analog Devices · Analog Devices application note AN-1386 (2016-06 (date as listed by the publisher)). Jitter and Phase Noise: time-interval error of sampling pulses and clock noise in the measured ADC signal.