Research note / Cycle 023
Two rises we already had
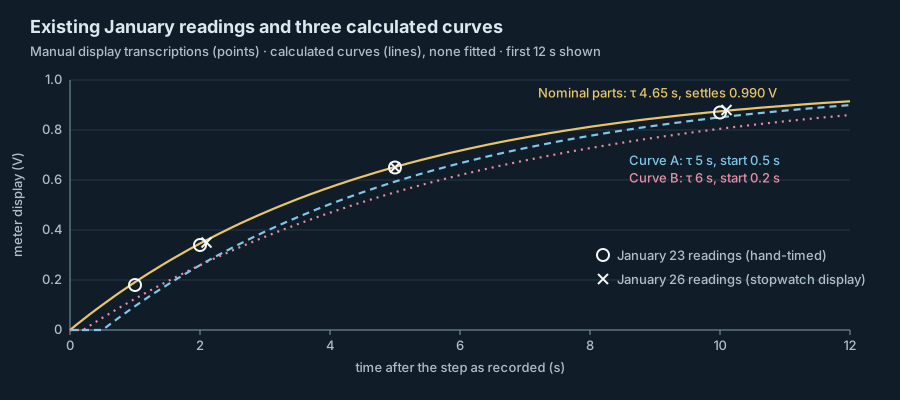
Eleven January readings of the RC surrogate, compared for the first time with the curves discussed since, sit close to what the labelled parts would give and well above the two delayed curves.
The readings on file
Aletheia’s amplifier will need an acquisition chain whose timing is known before any signal is interpreted. The test object is still AQ-RC01, an ordinary resistor and capacitor read with the handheld meter AQ-M01. Since Before the first reading the program has reasoned about a step that might begin later than the operator believes, most recently with two model curves in The interval between possible curves. That note recorded that earlier rise readings existed and were not compared with the curves.
There are two such sets. On January 23, in The circuit under the meter, six rise readings were written down at hand-timed intervals, with six fall readings beside them. On January 26, in How much circuit does the meter add?, five rise readings were transcribed against a stopwatch display. On February 20 Okafor and Ibarra compared all eleven rise readings with the curves. No new reading was taken. They also read the markings on the parts: the capacitor is a polarized aluminium electrolytic marked 47 µF and 25 V, and the resistor’s bands read 100 kΩ, 5%. Neither part was measured.
Five curves, none fitted
Each curve is the ideal first-order response, final value × (1 − exp(−(t − t0)/τ)), with parameters taken from an earlier record. Curve A (τ 5 s, start 0.5 s) and curve B (τ 6 s, start 0.2 s) are the pair from The edge before the reading. The undelayed 5 s curve is the January 30 model. The fourth uses the nominal parts with a modeled 10 MΩ meter input, a calculation already printed in The circuit under the meter: τ = 470/101 ≈ 4.65 s, settling at 100/101 ≈ 0.990 V. The fifth is described below.
The table gives every reading beside every curve. Curves A and B lie below the early readings, by as much as 0.085 and 0.099 V. The undelayed 5 s curve stays within 0.018 V. The nominal-parts curve stays within 0.011 V of all eleven readings and within 0.005 V, half a step of the display, for eight of them. Both rises read 0.99 V at 30 s, the value that curve settles to.
The five seconds used since January 30 was a round figure in the model file. The parts were always labelled for 4.7 s, and Analog Devices’ introductory RC activity happens to work the same example, 100 kΩ and 47 µF giving 4.7 s. Curves A and B inherited the round figure and added a delay. They were never set beside these readings.
What the agreement does not show
Nothing here is a fit, and closeness to one curve does not exclude others. The fifth curve was constructed after seeing the readings to make that point: τ 4.5 s with a start 0.15 s late stays within 0.010 V of every reading, as close as the nominal-parts curve. A delay of a tenth or two of a second cannot be told from none with these records. A delay of half a second with τ 5 s can: curve A misses the 1 s reading by 0.085 V.
Labels are not measurements. Nichicon’s general description of aluminium electrolytic capacitors gives ±20% as the standard capacitance tolerance, defined at 120 Hz and 20 °C, and notes that leakage current depends on time, applied voltage and temperature. With a 5% resistor the labels allow a time constant from about 3.6 to 5.9 s, a range that includes both 5 and 6 s. The readings sit nearer the nominal value than the labels alone would justify. That may be a property of these two parts or a coincidence. Measuring them would settle it.
Inverting each reading up to ten seconds for an undelayed step that settles at 0.99 V gives time constants between 4.60 and 4.98 s. Treating the display’s half-step as bounds, in the way NIST Technical Note 1297 treats a quantity known only to lie between two limits, moves each by about 0.1 s; that note does not discuss displays, and the application is ours. Timing matters far more early on. Half a second either way on the 1 s reading alone gives anything from 2.5 to 7.5 s. These are conditional figures and are not a time-constant estimate.
One check needs no time constant and no start time. Analog Devices’ transient-response activity gives the discharge with the same time constant as the charge, set by the resistance seen from the capacitor’s terminals. On January 23 the rise and fall readings at each time add to 0.99 V at five of the six times and to 1.00 V at the other. That is what one first-order circuit settling at 0.99 V would do if both runs were read with the same timing habits.
The four spoken-cue readings
The four readings in Four readings, no second clock were 0.31, 0.34, 0.33 and 0.29 V at a spoken two-second cue with no stopwatch transcription. On the nominal-parts curve those voltages correspond to 1.75, 1.96, 1.89 and 1.61 s after the step, between 0.04 and 0.39 s earlier than two seconds. The January 23 method already estimated the operator window at about half a second. The comparison shows that reading slightly early by different amounts on each run would be enough to produce that spread on an undelayed circuit. It does not show that this is what happened, and the sessions are not pooled.
Decision
Curves A and B are retired as working alternatives for this circuit. The earlier notes stand as written. The nominal-parts curve is kept as a comparison baseline and is not a calibrated value. The two-channel capture specification is still needed, since only a recorded step edge can bound a small delay. Measuring the resistor, the capacitor and the meter’s input now comes first, and every future reading will record how it was cued.
No time constant is fitted and no calibration is claimed. No amplifier, participant or implant is involved, and nothing in this comparison bears on the program’s ET/ED questions.
Results at a glance
| Session and stopwatch or nominal time | Reading (V) | Curve A (τ 5 s, start 0.5 s) | Curve B (τ 6 s, start 0.2 s) | Undelayed, τ 5 s | Nominal parts (τ 4.65 s, settles 0.990 V) | Constructed (τ 4.5 s, start 0.15 s) |
|---|---|---|---|---|---|---|
| January 23, 1 s | 0.18 | 0.095 | 0.125 | 0.181 | 0.191 | 0.170 |
| January 23, 2 s | 0.34 | 0.259 | 0.259 | 0.330 | 0.346 | 0.334 |
| January 23, 5 s | 0.65 | 0.593 | 0.551 | 0.632 | 0.652 | 0.653 |
| January 23, 10 s | 0.87 | 0.850 | 0.805 | 0.865 | 0.875 | 0.879 |
| January 23, 20 s | 0.98 | 0.980 | 0.963 | 0.982 | 0.977 | 0.978 |
| January 23, 30 s | 0.99 | 0.997 | 0.993 | 0.998 | 0.989 | 0.989 |
| January 26, 2.1 s | 0.35 | 0.274 | 0.271 | 0.343 | 0.360 | 0.348 |
| January 26, 5 s | 0.65 | 0.593 | 0.551 | 0.632 | 0.652 | 0.653 |
| January 26, 10.1 s | 0.88 | 0.853 | 0.808 | 0.867 | 0.877 | 0.882 |
| January 26, 20 s | 0.98 | 0.980 | 0.963 | 0.982 | 0.977 | 0.978 |
| January 26, 30.2 s | 0.99 | 0.997 | 0.993 | 0.998 | 0.989 | 0.989 |
External research and methods
- Introduction to RC Circuits · Analog Devices University Program · Wiki approved revision, 3 January 2018 18:35 (2018-01-03 approved wiki revision). Charging expression, time constant and the worked 100 kΩ, 47 µF example.
- Activity: Transient Response of RC Circuit, For ADALM1000 · Analog Devices University Program · Wiki approved revision, 3 November 2021 19:14 (2021-11-03 approved wiki revision). Equations (1), (3) and (4): time constant from the resistance seen by the capacitor, charging and discharging.
- 4. Type B Evaluation of Standard Uncertainty · National Institute of Standards and Technology · NIST TN 1297, Section 4 (NIST Technical Note 1297, online section; retrieved 2026-11-14). Subsection 4.6: a quantity known only to lie between two limits.
- General Descriptions of Aluminum Electrolytic Capacitors · Nichicon Corporation · Technical Notes CAT.8101H (Undated technical notes; retrieved 2026-11-14). Sections 1-6-1 and 1-6-3: standard capacitance tolerance, its measurement conditions and leakage current.